BoxWatch Review - Monitor All Servers from One Dashboard
If you manage servers, you know the tool sprawl. Metrics go to Datadog. Cron heartbeats go to Healthchecks.io. Uptime checks go to UptimeRobot. Process monitoring needs yet another solution. Before you know it, you are juggling four subscriptions, four dashboards, and four sets of alert configurations. BoxWatch takes the opposite approach. It combines all four into a single lightweight agent with one command install and surfaces everything in one beautiful dashboard.
What Is BoxWatch?
BoxWatch is an all-in-one server monitoring platform designed for network admins, developers, and security pros who want complete infrastructure visibility without the complexity and cost of enterprise observability tools. It replaces four separate monitoring tools: metrics collection, cron job heartbeats, uptime checks, and process monitoring. All of this runs through a single open-source bash agent and a unified dashboard.
The agent collects only system performance metrics: CPU, memory, disk, network, load, and uptime. It does not touch your files, logs, or databases. Since the agent script is open source, you can audit every line before it ever runs on your infrastructure. Privacy is not a checkbox feature. The agent collects system metrics, nothing else.
Installation is intentionally simple:
curl -sL boxwatch.app/install.sh | bash -s YOUR_KEYFrom curl command to live dashboard in under sixty seconds. Uninstalling is just as clean with a companion uninstall script, and removing the server from the dashboard takes one click.
Who Is It For?
BoxWatch serves three distinct audiences, each with a common need to monitor servers without the overhead of traditional tools:
- Network admins managing fleets of servers who need a unified view of system health. BoxWatch gives them CPU, memory, disk, and network metrics across all servers in one dashboard, with side-by-side comparison views and disk-full prediction that warns days before a volume fills.
- Developers who deploy cron jobs, web services, or background daemons and want to be alerted when something breaks. Instead of wiring together separate services for heartbeat monitoring and uptime checks, they configure everything in one place.
- Security pros who need to know exactly what monitoring software is doing on their systems. The open-source agent means no black-box binaries, no hidden telemetry, and no vendor access to internal data.
Main Features
Server Metrics: CPU, Memory, Disk, Network
The foundation of BoxWatch is real-time system metrics collection. The agent gathers CPU, memory, disk, network, load average, and uptime data from every server and sends it to a centralized dashboard. You get trend charts over configurable time windows, side-by-side comparison views to spot outliers across your fleet, and a disk-full prediction feature that uses 7-day linear regression modeling to warn you days before a volume actually runs out of space.
Collection intervals vary by plan: 60 minutes on the free Hobby tier, 5 minutes on Pro and Team, and 1 minute on Scale. For most use cases outside of high-frequency trading or real-time debugging, the 5-minute Pro interval strikes a good balance between granularity and overhead.
Cron Heartbeat Monitoring
Every scheduled job gets a unique ping URL, whether it runs via cron, systemd timer, Kubernetes CronJob, or GitHub Actions workflow. Each URL provides three endpoints: /start to signal job begin, /success for successful completion, and /fail/:code to report failures with custom exit codes. When a job fails to check in or a previously successful job starts failing, BoxWatch triggers an alert.
The alert system uses transition-based deduplication, meaning you get notified when a job state changes from healthy to failing, not spammed with repeat notifications for every subsequent failure. Four alert types cover start, success, failure, and missing events. Quotas range from 20 cron checks on the free Hobby plan to unlimited on Team and Scale.
Uptime Checks: HTTP, TCP, and TLS
Where BoxWatch differs from hosted uptime services is in how checks are executed. Instead of probing from the vendor's data centers, your own deployed agents perform HTTP, TCP, and TLS-expiry checks. This architecture provides two significant advantages. Note that uptime checks currently require a Linux agent (v2.1+), the same as process monitoring.
First, multi-region monitoring becomes a natural side effect of your server fleet. If you have agents in Frankfurt, Singapore, and Virginia, you get uptime checks from all three regions at no extra cost. Second, you can monitor internal-network endpoints that external services cannot reach: private Redis instances, internal APIs, database ports, or staging environments behind firewalls. TLS certificate expiry tracking helps you avoid the embarrassing outage that comes from a forgotten certificate renewal.
Process Monitoring
BoxWatch watches named processes on every server: nginx, postgres, redis-server, or any custom daemon. It tracks per-process CPU and memory usage and fires alerts when a process disappears, restarts, or exceeds defined resource thresholds. Per-server quotas scale with your plan: 10 processes on Hobby, 50 on Pro, 100 on Team, and unlimited on Scale. Process monitoring is currently available on Linux only (v2.0).
Alerts and Notifications
When things go wrong, BoxWatch reaches you through email, Slack, Discord, or any webhook endpoint. The webhook integration supports custom headers, making it compatible with PagerDuty, Zapier, n8n, or any custom automation pipeline you have built. Smart cooldown timers prevent alert storms during cascading failures, recovery notifications confirm when issues resolve, and maintenance windows suppress noise during planned maintenance while excluding that downtime from SLA calculations.
Status Pages, SLA Tracking, and TV Mode
Paid plans include branded public status pages with incident management, a feature that often costs extra on competing platforms. SLA uptime tracking covers 24-hour, 7-day, 30-day, and 90-day windows with color-coded indicators. An uptime badge in the style of Shields.io updates automatically every 5 minutes and can be embedded in your README, documentation, or website.
For network operations centers or office wall displays, the TV dashboard mode provides a full-screen dark theme with auto-refresh, optimized for at-a-glance fleet health visibility.
Weekly Reports, 2FA, and API Keys
Weekly digest emails provide a snapshot of infrastructure health, and monthly detailed reports offer deeper trend analysis. Security-conscious teams will appreciate 2FA support and scoped API keys that let you grant granular access without exposing full account permissions. All billing is handled through Stripe for self-service plan management.
How It Works
Getting started with BoxWatch takes about sixty seconds:
- Sign up for free at boxwatch.app and retrieve your unique API key from the dashboard.
- Run one curl command on each server you want to monitor. The open-source bash agent self-installs, configures a cron entry, and begins collecting CPU, memory, disk, network metrics immediately.
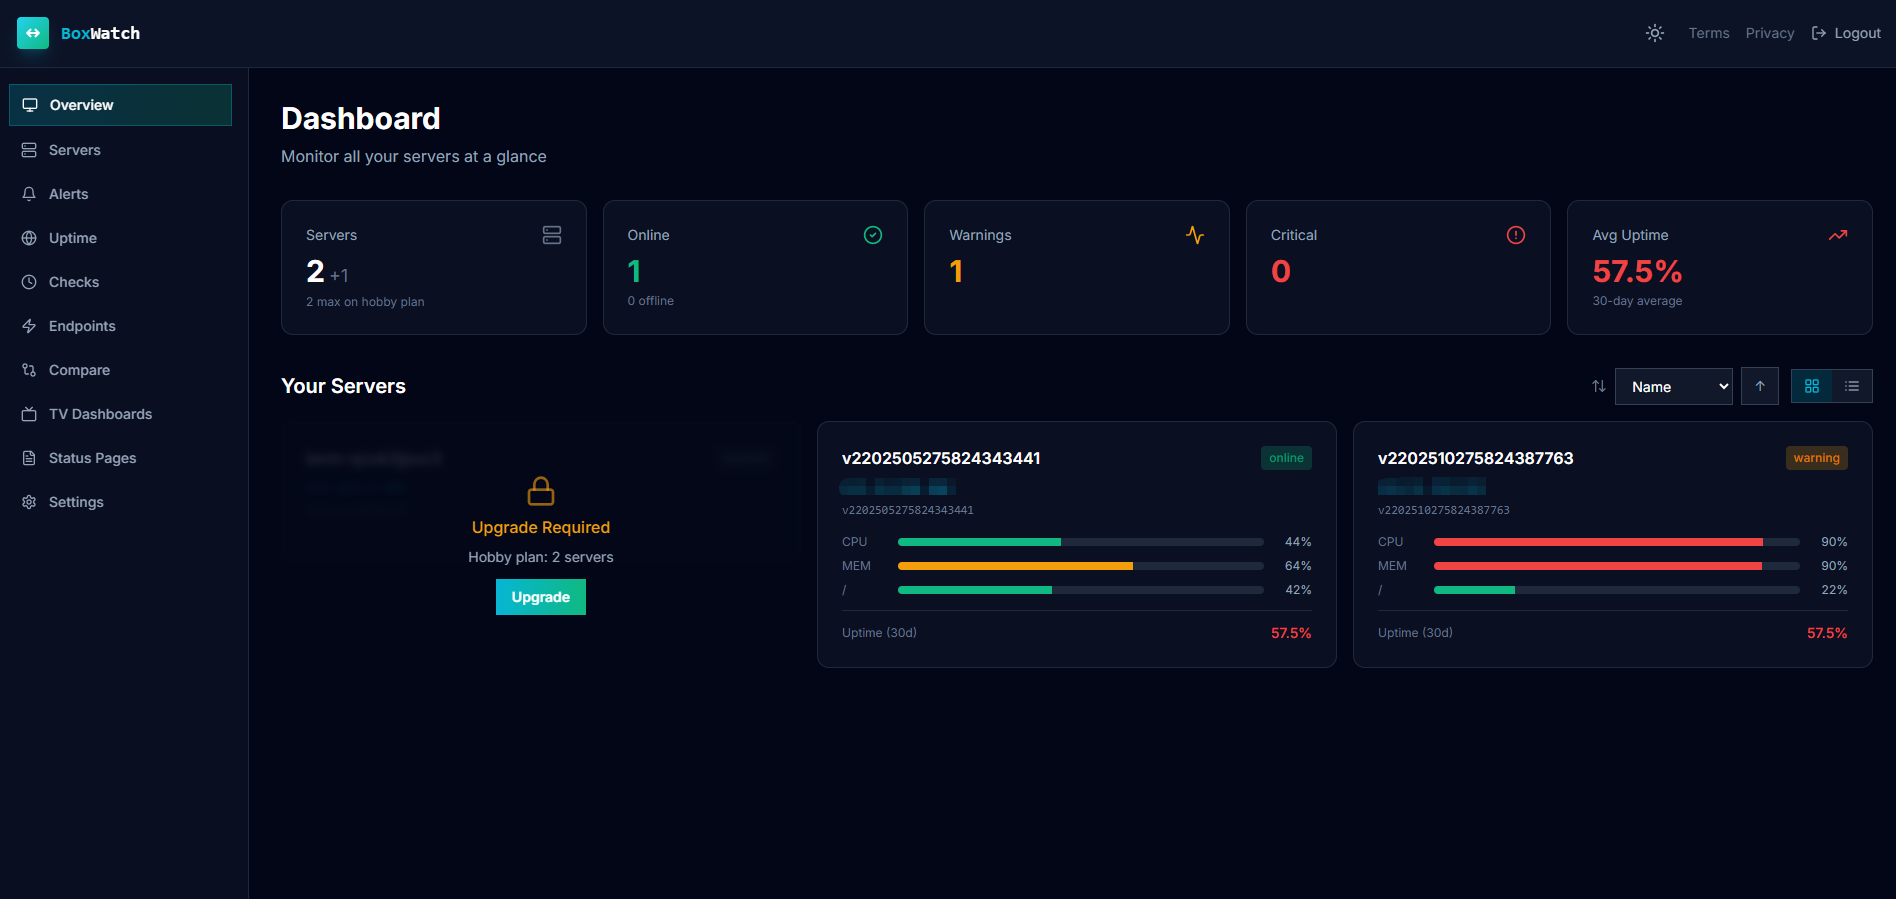
- Monitor all your servers from one beautiful dashboard: system metrics, cron heartbeats, uptime status, and process health, all in a single pane of glass.
The agent runs as a cron job at your plan's collection interval, gathers system metrics from standard Linux proc and sys filesystems, and POSTs the data to the BoxWatch API. There is no persistent daemon to manage, no ports to open, and no firewall rules to reconfigure. Data in transit is encrypted, and the agent never reads files, logs, or database contents.
BoxWatch vs Competitors
Most teams running server monitoring today piece together multiple services. Here is how BoxWatch compares against the tools it replaces at the 7-server Pro tier:
| Capability | BoxWatch Pro | Datadog | UptimeRobot | Healthchecks.io |
|---|---|---|---|---|
| CPU, memory, disk, network metrics | ✅ | ✅ | ❌ | ❌ |
| Cron heartbeat monitoring | ✅ | ✅ | ❌ | ✅ |
| HTTP/TCP/TLS uptime checks | ✅ | ✅ (SaaS-based) | ✅ (SaaS-based) | ❌ |
| Process monitoring | ✅ | ✅ (separate agent) | ❌ | ❌ |
| Monthly price (7 servers) | $13/mo | $105+/mo | $7/mo | $20/mo |
| Internal network checks | ✅ | ❌ | ❌ | ❌ |
| Open-source agent | ✅ | ❌ | ❌ | ✅ |
| Built-in status pages | ✅ | ✅ (paid add-on) | ✅ | ❌ |
The cost difference is substantial.
Datadog starts around $15 per host per month for infrastructure monitoring. That alone hits $105/month for 7 servers, and cron plus uptime monitoring require add-on products with their own per-host pricing. In practice, many teams reach for separate tools like Healthchecks.io ($20/month) and UptimeRobot ($7/month) instead, pushing the combined monthly total past $130.
BoxWatch Pro covers metrics, cron heartbeats, uptime checks, and process monitoring for $13/month. That is roughly one-tenth the cost, with no add-on fees and no per-check charges. The Hobby plan is free forever, no credit card required, covering up to 5 servers.
Pricing
BoxWatch uses a simple server-count model with no per-metric, per-check, or per-alert fees. Every plan includes unlimited data ingestion.
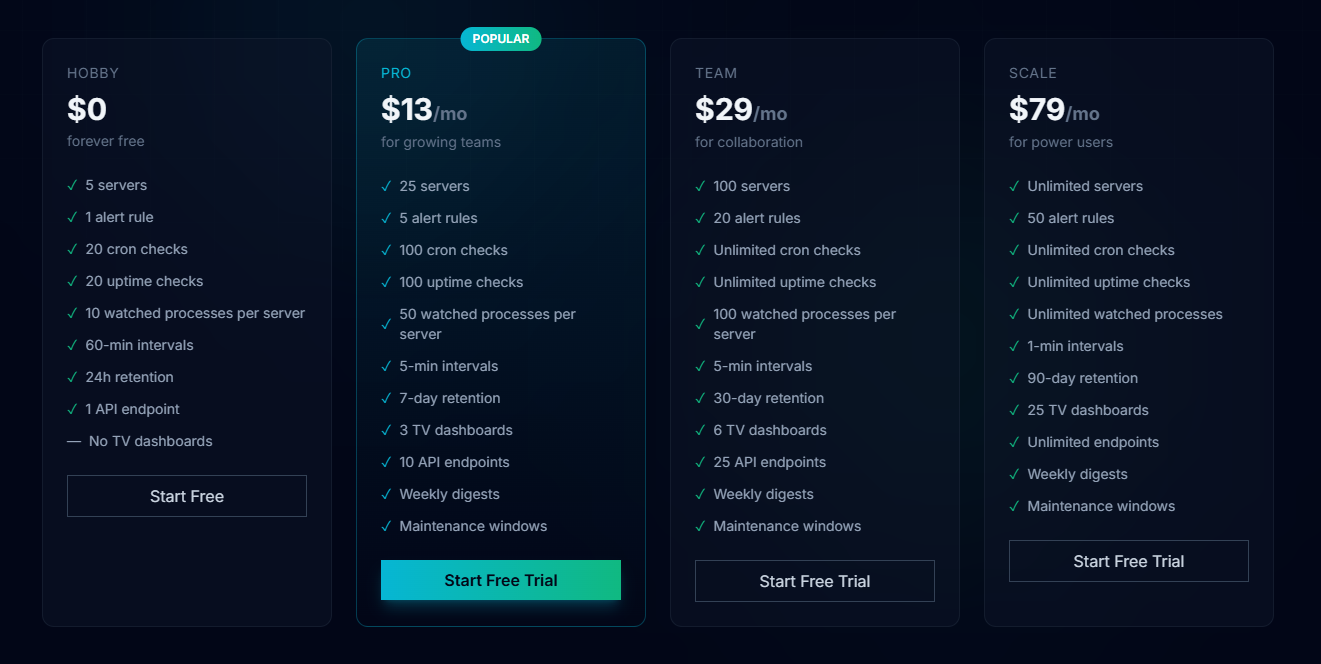
| Plan | Monthly Price | Servers | Alert Rules | Cron Checks | Uptime Checks | Process Monitor | Interval | Data Retention |
|---|---|---|---|---|---|---|---|---|
| Hobby | Free | 5 | 1 | 20 | 20 | 10/server | 60 min | 24 hours |
| Pro | $13/mo | 25 | 5 | 100 | 100 | 50/server | 5 min | 7 days |
| Team | $29/mo | 100 | 20 | Unlimited | Unlimited | 100/server | 5 min | 30 days |
| Scale | $79/mo | Unlimited | 50 | Unlimited | Unlimited | Unlimited | 1 min | 90 days |
The Hobby plan is free permanently, with no trial expiration and no credit card requirement. It covers up to 5 servers, making it suitable for personal projects, homelabs, or evaluating the platform before upgrading. If your fleet grows beyond your plan's server limit, additional servers are marked inactive and stop receiving metrics. Upgrading reactivates them immediately without data loss. The Scale plan offers unlimited servers at $79/month. Enterprise plans for custom SLAs are available through the sales team.
Pros and Cons
What we like:
- Replaces four monitoring tools with one agent and one dashboard, cutting both complexity and cost
- Open-source bash agent that you can fully audit before installation
- One curl command installs everything in under sixty seconds
- Free Hobby tier with 5 servers, no credit card required
- Transparent pricing: no per-metric fees, no per-check charges, no surprise overage bills
- Agent-based uptime checks can monitor internal network endpoints inaccessible to SaaS tools
- Disk-full prediction using 7-day linear regression warns before volumes fill
- Maintenance windows suppress alerts during planned downtime and exclude it from SLA calculations
- Public status pages with incident management included in paid plans at no extra cost
- Process monitoring with per-process CPU and memory usage tracking
- Alerts via email, Slack, Discord, and configurable webhooks
- 2FA and scoped API keys for secure team access
What could be better:
- Hobby plan uses a 60-minute collection interval, limiting real-time visibility on the free tier
- Process monitoring and uptime checks currently support Linux only (require agent v2.0+ and v2.1+ respectively)
- No native mobile application; monitoring relies on the web dashboard and alert integrations
- Agent is bash-only with no native Windows agent for non-WSL environments
- Data retention on the free tier is limited to 24 hours
- Maintenance windows are not available on the Hobby plan
- Hobby and Pro plans have limited TV dashboard slots (Pro: 3, Team: 6, Scale: 25)
Tips for Getting Started with BoxWatch
To get the most from this server monitoring platform:
- Start with the free Hobby tier on up to five servers to evaluate the dashboard and alert workflow before upgrading. No credit card means no commitment.
- Set up cron heartbeats immediately for all critical scheduled jobs. Knowing that a backup script silently failed is often more important than watching CPU charts.
- Deploy agents across regions if you have servers in multiple data centers. This gives you multi-region uptime monitoring as a natural side effect of your existing fleet.
- Use server groups to organize hosts by environment (production, staging, development) or by client if you manage infrastructure for multiple customers.
- Configure maintenance windows before running planned updates to avoid false alerts and keep your SLA metrics accurate.
- Set up webhook alerts to your team's communication platform early. Slack and Discord integrations take seconds to configure and ensure alerts are seen where your team already works.
Final Verdict
BoxWatch is a practical server monitoring solution because it does what most teams need and skips what they do not. The pitch is straightforward: one agent, one dashboard, one predictable bill. It covers the four monitoring jobs that usually require separate subscriptions and separate dashboards.
The open-source agent sets it apart from proprietary alternatives by giving you full visibility into what runs on your infrastructure. The agent-based uptime checking architecture solves a real problem that hosted competitors cannot address: monitoring internal network endpoints. And at $13/month for 25 servers on the Pro plan, the pricing is an order of magnitude below what comparable functionality costs across separate tools.
For network admins, developers, and security pros seeking to consolidate their server monitoring stack into a single lightweight tool that covers CPU, memory, disk, network metrics, cron heartbeats, uptime checks, and process monitoring, BoxWatch is well worth evaluating. The free Hobby tier with no credit card makes it risk-free to try.
Want to monitor all your servers from one beautiful dashboard? Sign up for Free at BoxWatch. One command, sixty seconds.
Tags
# Review# BoxWatch# Server Monitoring# server monitoring tool# CPU monitoring# memory monitoring# disk monitoring# network monitoring# cron monitoring# uptime monitoring# process monitoring# Datadog alternative# infrastructure monitoring# server metrics# open source monitoring agent# monitor serversFollow for new blogs
Subscribe to our blog
Subscribe to Newsletter
Subscribe to our newsletter to get the best products weekly.