Prilog Review - Self-Healing Bug Fixes via Automated GitHub Pull Requests
Production bugs still wake up engineers at 3 AM. Your monitoring stack fires alerts. Your error tracker groups exceptions. Your on-call engineer opens the logs, traces the stack, hunts through the codebase, and hours later opens a PR. Detect, triage, investigate, fix — the entire workflow relies on a human reading traces and stitching together context.
It's 2026 and we still have bugs in Software, it's ironic, isn't it?
Prilog takes a fundamentally different approach. Instead of just alerting your team about bugs, it traces the root cause, drafts a fix, and submits an automated GitHub PR ready for human review.
What Is Prilog?
Prilog is an AI agent for bug fixes that connects to your error tracking, logs, codebase, and GitHub to turn production incidents into reviewed and merged pull requests. It is built around a simple idea: the distance between detecting a bug and shipping a fix should be measured in minutes, not hours or days. The product claims it can reduce mean time to resolution (MTTR) by up to 90% by automating the investigation and drafting phases.
The product calls itself self-healing software. That label can sound like marketing hype, so let me be concrete: Prilog does not push code to production on its own. What it actually does is build a production remediation graph — learning from each approved fix, which review preferences your team applies, and how failures cascade across your architecture. Every fix stays human-approved. Prilog does not replace your code review process. It replaces the hours of manual debugging that happen before the PR even exists, and gets smarter with each incident resolved.
Under the hood, Prilog pulls logs and traces from over 30 observability sources: Datadog, SigNoz, OpenTelemetry, AWS CloudWatch, Google Cloud Logging, Azure Monitor, Sentry, Grafana Loki, Honeycomb, Splunk, New Relic, and more. From there it maps each issue to the right repository, service, deployment history, and code path. Then it drafts a fix with an explanation of what went wrong, which files are affected, and opens a PR on GitHub, GitLab, or Bitbucket. If your team would rather triage first, it can route the task to Jira, Linear, or GitHub Issues instead.
Who Is It For?
Prilog targets engineering organizations where production incidents create a recurring tax on developer productivity:
- Software engineering teams at fast-moving SaaS companies that ship frequently and deal with production bugs, customer-reported issues, and incident backlogs. Prilog shifts their workflow from "investigate and fix" to "review and merge."
- CTOs and VPs of Engineering who want to reduce software downtime without expanding headcount. Prilog automates the most time-consuming part of incident response, root cause investigation, and lets senior engineers stay focused on building rather than firefighting.
- SREs and DevOps teams responsible for production reliability. Prilog complements existing observability stacks by converting the signal they already collect into actionable code fixes, closing the gap between monitoring and resolution.
- Platform and infrastructure teams that manage multiple services with shared dependencies. Prilog's remediation graph maps failure patterns across services, reducing the tribal knowledge required to debug cross-service incidents.
If your team already uses Datadog, Sentry, or OpenTelemetry and spends more than a few hours per week on automated debugging of recurring production issues, Prilog is built for your workflow.
Main Features
Automated Issue Tracing and Root Cause Analysis
Prilog ingests production logs, traces, and error reports from your existing observability stack and surfaces only the recurring issues worth fixing, not every one-off exception. This filtering matters; a busy production system generates a lot of noise. Prilog's root cause analysis automation engine identifies patterns across events, grouping related failures and eliminating duplicates before an engineer ever looks at them.
Once an issue is flagged, Prilog maps it to the relevant code repository, service boundary, deployment history, and specific file paths. This mapping is what sets Prilog apart from a traditional alerting tool. Instead of dropping an engineer into a log stream with a stack trace and a prayer, Prilog delivers the full context: which service, which deployment, which code paths, and which dependencies are involved.
AI-Generated Fixes with Context
The core of Prilog is its AI bug fixing engine. For each detected issue, Prilog drafts a ready-to-review code fix that includes:
- The specific code changes required to resolve the issue
- A written explanation of the root cause and why the fix works
- A list of all affected files and their roles in the failure
- CI verification status indicating whether the proposed fix passes existing tests
A representative example from the Prilog website involves a payment retry bug causing duplicate charges. The generated fix builds a charge key from order and payment identifiers, checks if the charge was already captured, and returns the existing transaction instead of processing a duplicate. That is the kind of fix that takes an engineer an hour to research and ten minutes to code. Prilog delivers it as a draft PR ready for review.
Automated GitHub PR Creation
Most AI developer tools give you analysis or suggestions. Prilog gives you actual pull requests. Each fix lands on GitHub, GitLab, or Bitbucket as a standard PR with a title, description, linked issue references, and the same CI checks your team already runs. Your engineers review, comment, request changes, and merge exactly as they would with a human-authored PR.
If your team prefers to triage before coding, Prilog can route issues to Jira, Linear, or GitHub Issues instead of opening a PR directly. This flexibility means Prilog fits into your existing workflow rather than forcing you to adopt a new process.
Code-Aware Debugging
Prilog reads your repositories, understands service boundaries, and traces failure paths through your actual code. This code-aware debugging makes the generated fixes relevant instead of generic. When Prilog drafts a fix for a timeout in your payment service, it understands that the issue is in payments-api/capture.ts, knows which retry logic is involved, and generates a fix that respects your existing patterns and dependencies.
Prilog Memory: The Self-Healing Graph
One of Prilog's most distinctive features is the Prilog Memory, a production remediation graph that maps your system's failure patterns across services, dependencies, and deployments. Each time your team reviews and approves a fix, the graph learns which remediation patterns work for your architecture, which review preferences your team applies, and how failures cascade across services. This is not just pattern matching — it's a connected model of your production system. Fixes become progressively faster and more accurate over time as the system learns your codebase.
Human-in-the-Loop by Design
Prilog does not push code directly to production. Every fix requires human review and approval. The approval threshold is architectural, not a configurable setting you could turn off. This is a pragmatic line to draw: AI can dramatically accelerate the investigation-to-draft pipeline, but engineering judgment stays at the final gate. The site puts it well: "built to heal systems, not to replace engineering judgment."
Integrations: 30+ Observability Sources
Prilog connects to a wide range of logging and tracing platforms:
- Cloud providers: AWS CloudWatch, Google Cloud Logging, Azure Monitor
- APM and observability: Datadog, New Relic, Dynatrace, Honeycomb, SigNoz, Grafana Loki
- Error tracking: Sentry, Rollbar, Bugsnag
- Open standards: OpenTelemetry, Jaeger, Zipkin
- Log management: Splunk, Elastic, Coralogix, Sumo Logic, Logz.io, Axiom, Better Stack
- Streaming and storage: Kafka, Fluentd, S3 Log Archives
On the output side, Prilog integrates with GitHub, GitLab, and Bitbucket for PR creation, and Jira, Linear, GitHub Issues, and Slack for task routing.
How It Works
Prilog's workflow follows a four-stage pipeline:
- Detect: Prilog ingests logs and traces from your connected observability sources and filters for recurring, actionable issues. It suppresses noise, groups related failures, and surfaces the problems worth engineering attention.
- Map: Each detected issue is mapped to the relevant code repository, service, deployment history, and exact code paths. This context-gathering step replaces the manual investigation that engineers perform during incident response.
- Draft: The AI bug fixing engine generates a code fix with root cause explanation, affected files, and CI verification. Convert hours of debugging into a draft PR ready for review.
- Review & Route: Your team reviews the generated PR through the standard code review workflow. Alternatively, you can route the issue to Jira, Linear, or GitHub Issues for prioritization in your existing backlog.
The entire pipeline runs on a three-layer architecture. The input layer handles observability data. The engine layer combines LLMs (OpenAI, Anthropic, or Ollama) with Prilog's own issue-to-PR logic and memory graph. The output layer delivers fixes to your repositories or task management tools.
Security and Compliance
Prilog's security posture covers several areas that matter to enterprise teams:
- Tenant-scoped data isolation: Customer data stays scoped and segmented by workspace. This is a foundational isolation mechanism, not a post-hoc feature.
- Encryption at rest: All data and credentials are encrypted by default.
- PII stripping: Personally identifiable information and sensitive values are stripped or redacted before analysis.
- No training on customer data: Prilog explicitly states that customer data is never used for model training.
- Compliance alignment: GDPR compliance, ISO 27001-aligned controls, and SOC 2 Type II evidence are available. Prilog can also complete enterprise security questionnaires and DPIAs.
These measures are non-negotiable for any tool that reads your codebase and production logs. Prilog checks the boxes.
Pricing
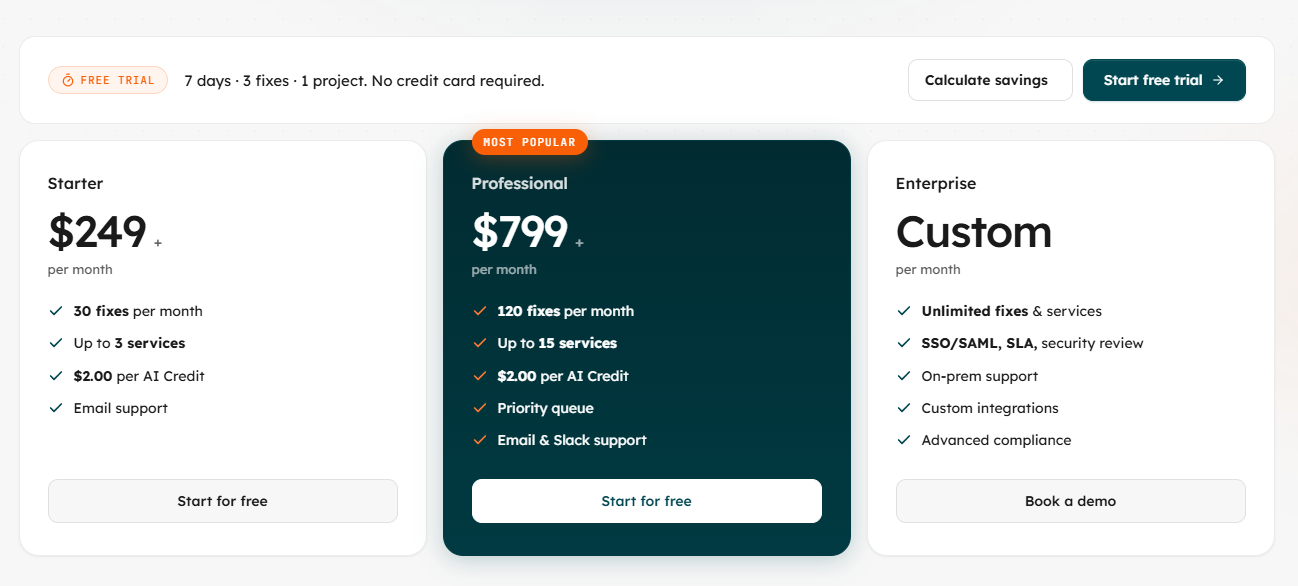
Prilog offers a 7-day free trial with no credit card required, including 3 fixes across 1 project. Paid plans are priced by usage:
| Plan | Monthly Price | Fixes/Month | Services | AI Credit Cost | Support |
|---|---|---|---|---|---|
| Free Trial | 7 days, free | 3 | 1 project | N/A | N/A |
| Starter | $249/mo | 30 | Up to 3 | $2.00/credit | |
| Professional | $799/mo | 120 | Up to 15 | $2.00/credit | Email & Slack, priority queue |
| Enterprise | Custom | Unlimited | Unlimited | Custom | SSO/SAML, SLA, security review, on-premise, custom integrations |
The pricing page includes a built-in cost savings calculator that factors in engineer hourly rate, average debugging time per bug, and downtime costs. The math is straightforward: if each fix saves several hours of engineering investigation time, a single automated fix can justify the Starter plan's cost.
Prilog is priced for teams that already feel the cost of manual debugging. It is not a tool for hobby projects or side ventures. The $249/month Starter tier makes that clear: this is built for professional teams where bug investigation time carries real business cost.
Prilog vs Traditional Debugging Workflows
Most teams today follow a manual production incident resolution workflow: alert fires → engineer acknowledges → engineer opens logs → engineer traces code paths → engineer diagnoses root cause → engineer writes fix → engineer opens PR → team reviews → merge and deploy. Each step between alert and PR is manual, context-switching-intensive, and slow.
Prilog automates the middle of that pipeline: investigation, tracing, diagnosis, and drafting. The engineer lands directly at the review step. Here is how that difference looks side by side:
| Capability | Prilog | Manual Debugging | Traditional Monitoring Tools |
|---|---|---|---|
| Detects production issues | ✅ (from your existing tools) | ✅ (engineer reads alerts) | ✅ (designed for this) |
| Maps issue to code path | ✅ (automated) | ❌ (manual investigation) | ❌ (not designed for this) |
| Generates code fix | ✅ (draft PR) | ❌ (manual coding) | ❌ (not designed for this) |
| Opens PR in repository | ✅ (automated GitHub PRs) | ❌ (manual) | ❌ (not designed for this) |
| Learns from past fixes | ✅ (remediation graph) | ❌ (tribal knowledge only) | ❌ (not designed for this) |
| Human approval required | ✅ (built-in) | ✅ | N/A |
Traditional monitoring tools like Datadog, Sentry, and Grafana are excellent at detection. Prilog does not aim to replace them. It consumes their output and extends the pipeline from detection to resolution. It is complementary, not a rip-and-replace.
Pros and Cons
What we like:
- Automates the most time-consuming phase of bug fixing: investigation and root cause analysis, turning hours of debugging into minutes of code review
- Generates working pull requests with explanations, not just diagnostic suggestions or code snippets
- Integrates with 30+ observability platforms, covering the tools most engineering teams already use
- Prilog Memory builds a self-improving model of your system's failure patterns
- Human approval is architecturally required, not optional. Teams retain full control over what ships
- PII stripping and data isolation address the security concerns of connecting a third-party tool to production logs and codebases
- No customer data used for model training
- SOC 2 Type II, GDPR, and ISO 27001 alignment for enterprise procurement
- Works with GitHub, GitLab, and Bitbucket for PRs, plus Jira, Linear, and GitHub Issues for task routing
- 7-day free trial with no credit card required
What could be better:
- Pricing starts at $249/month, which prices out small teams and indie developers who might benefit from occasional AI bug fixing
- Free trial limits to 3 fixes and 1 project, which may not be enough to evaluate the memory graph's cumulative improvement over time
- Effectiveness depends on the quality of your existing observability data. Teams with poor logging will see poorer results
- The memory graph's value accumulates with usage. Teams that only use Prilog occasionally may not see its full benefit
- No public documentation about supported languages or frameworks, so it is unclear whether Prilog works equally well across different tech stacks
- Limited public information about the founding team and company background
- Enterprise on-premise deployment requires custom pricing, no self-hosted option for teams with strict data residency requirements
- No native mobile app for reviewing or approving fixes on the go
Tips for Getting Started with Prilog
To get the most from this AI software maintenance platform:
- Start with a recurring bug, not a novel one. Prilog's engine excels at pattern-based detection, so high-frequency, well-understood failure modes like payment retries, API timeouts, or service degradation are where you will see the most immediate value.
- Ensure your observability data is clean. Prilog ingests logs and traces from your existing stack. If your logs are inconsistent or unstructured, the mapping and drafting quality will suffer. Invest in structured logging before connecting Prilog.
- Connect your most critical service first. The Professional plan covers up to 15 services, but starting with one high-impact service lets you evaluate the workflow, build trust in the generated fixes, and train the memory graph on a focused domain.
- Treat generated PRs like any other PR. Review them with the same scrutiny you would apply to a junior engineer's code. Prilog accelerates the drafting phase, but it does not eliminate the need for thorough review.
- Route non-critical fixes to your backlog. Not every generated fix needs to be an immediate PR. Use the Jira or Linear routing option to queue lower-priority fixes for sprint planning, keeping the PR workflow focused on high-urgency issues.
- Monitor the memory graph's improvement over time. The real value of self-healing software compounds: as your team approves fixes, the system learns your codebase patterns and review preferences, making future fixes progressively better.
Final Verdict
Prilog is not a monitoring tool or an alerting tool. It is an AI agent for bug fixes that sits downstream of your existing observability stack and answers the question those tools leave open: "Now what?"
Here is the core pitch. Engineering teams spend a huge chunk of their time not writing code, but hunting through logs, tracing stack traces, and reconstructing failure paths. Prilog automates that hunting phase and delivers a draft fix as a pull request. Your team goes from investigating to reviewing. Hours of context-switching become minutes of focused code review.
For engineering leaders who want to reduce software downtime without expanding their team, Prilog offers a compelling approach: let AI handle the tedious, time-consuming detective work of root cause analysis automation, and keep your senior engineers focused on architecture, features, and the fixes that truly require human judgment.
The $249/month starting price and enterprise-grade security posture make the target audience obvious: this is for professional engineering organizations, not weekend projects. For SaaS teams, platform teams managing microservice architectures, and SRE organizations buried in incident queues, the math is favorable. One automated fix per month justifies the cost.
The self-healing software vision Prilog pursues is ambitious but grounded. Not a fully autonomous AI that pushes code to production; a system that learns from each fix, gets faster over time, and always keeps a human in the loop. In 2026, that feels like the right balance.
Ready to turn production bugs into reviewed pull requests? Sign up for a free 7-day trial — no credit card required.
Tags
# Review# Prilog# AI bug fixing# automated debugging# self-healing software# AI developer tools# production incident resolution# automated GitHub PRs# AI software maintenance# root cause analysis automation# AI agent for bug fixes# reduce software downtime# AI code review# incident management# developer productivityBoxWatch Review - Monitor All Servers from One Dashboard
ShipThing Review - The Ultimate Next.js SaaS Boilerplate
Follow for new blogs
Subscribe to our blog
Subscribe to Newsletter
Subscribe to our newsletter to get the best products weekly.